Confidential Broker Opinion of Value
5464 Yarmouth Ave
Encino, CA 91316
66Units
51,120Square Feet
1969Year Built
60,960SF Lot
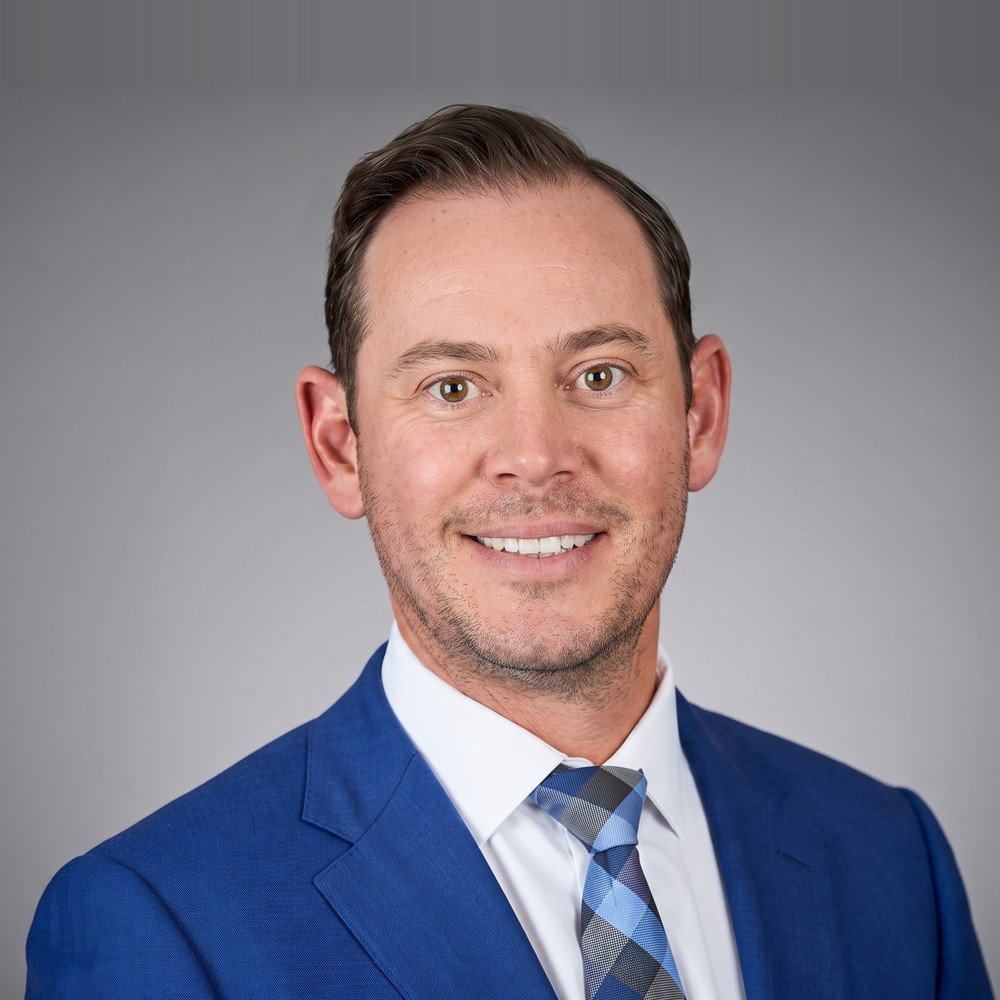
Morgan Wetmore
Morgan Wetmore
Associate
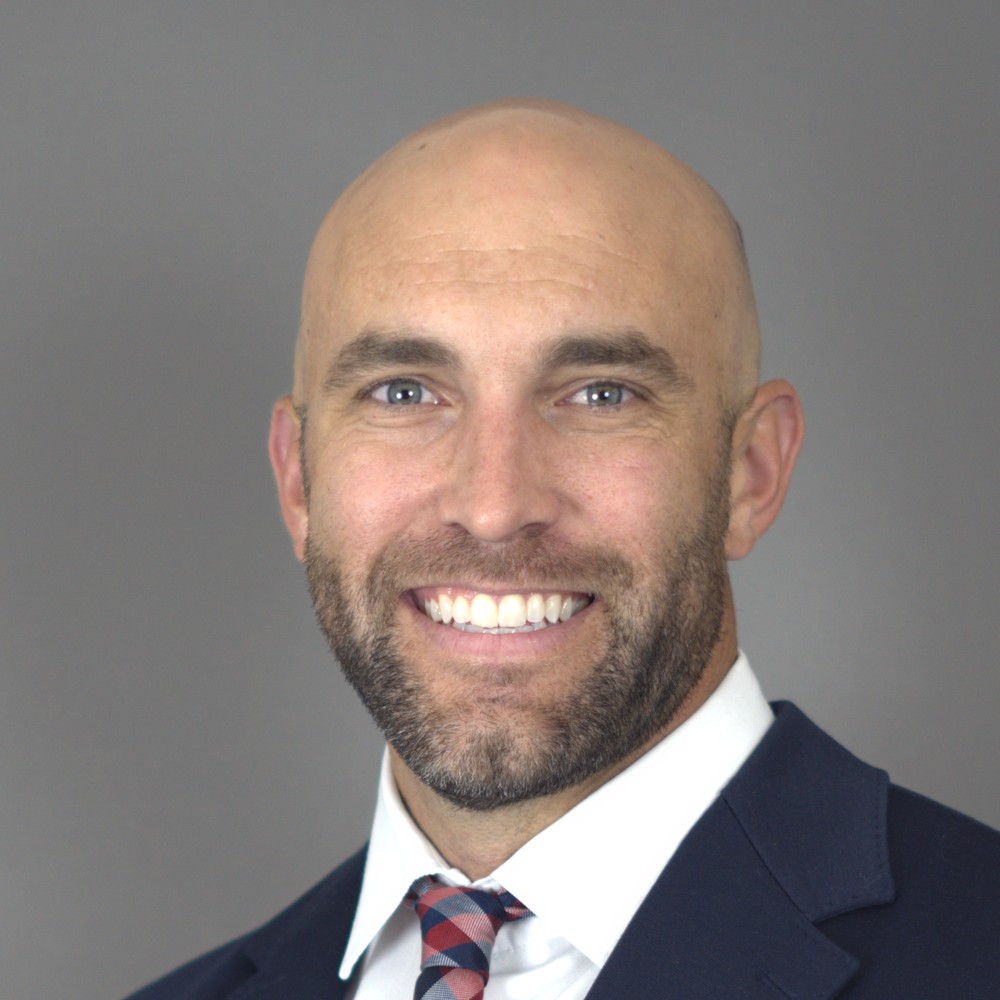
Glen Scher
Glen Scher
Senior Managing Director Investments
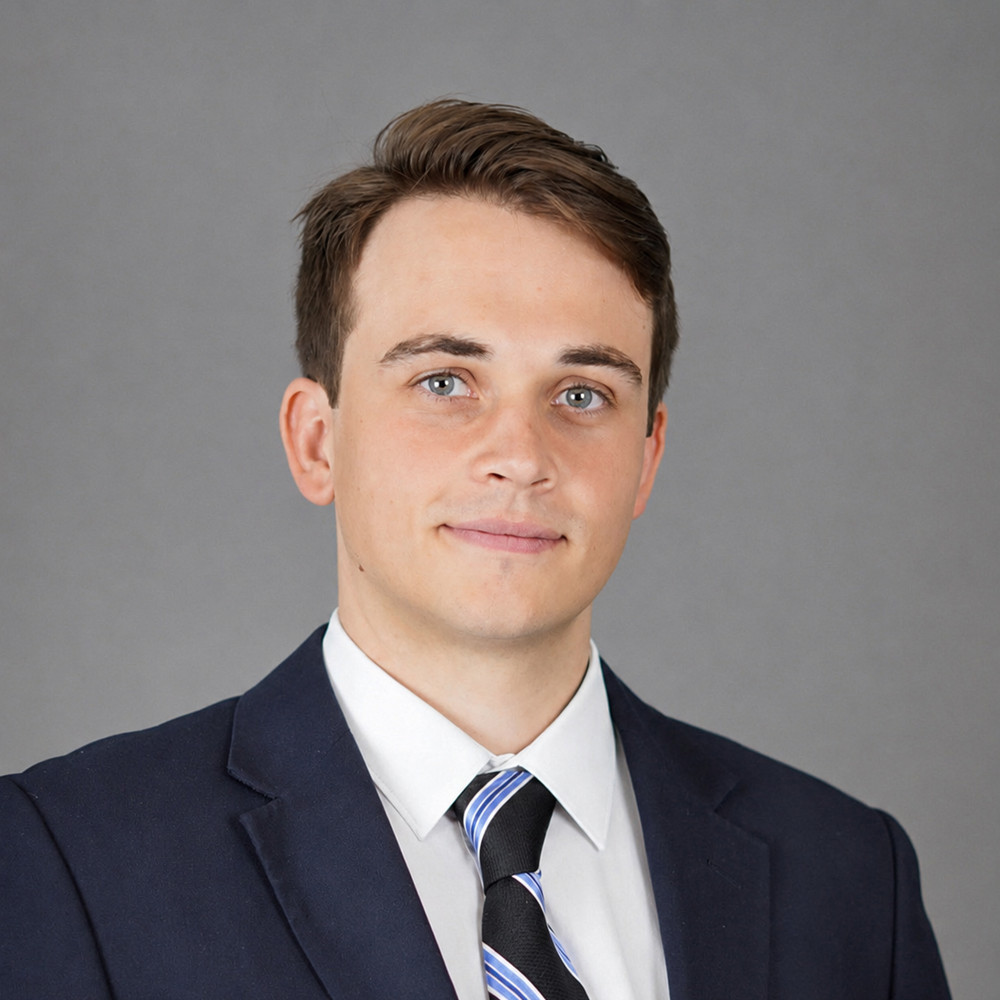
Filip Niculete
Filip Niculete
Senior Managing Director Investments

Prepared Exclusively for 5464 Yarmouth Avenue Apartments

August 2026

Team Track Record
Current Results, Local Market Experience, and Senior-Level Execution
LAAA Team | Marcus & MillichapLocal market knowledge. National reach. Senior-level execution.
493Closed Transactions
341Apartment Sales
13Within 3 miles
$1.55BTotal Sales Volume

Representative Local Closings

AddressUnitsSale Price$/UnitDistanceClosed
17800 Magnolia Blvd21$6,100,000$290,4760.36 mi2023
18529 Calvert St24$9,725,000$405,2081.25 mi2019
7108 Amigo Ave34$13,900,000$408,8242.27 mi2022
96.7%Apartment Pricing Accuracy
34Median Days on Market, Apartments

Published team performance, laaa.com/track-record, as of August 20, 2026.

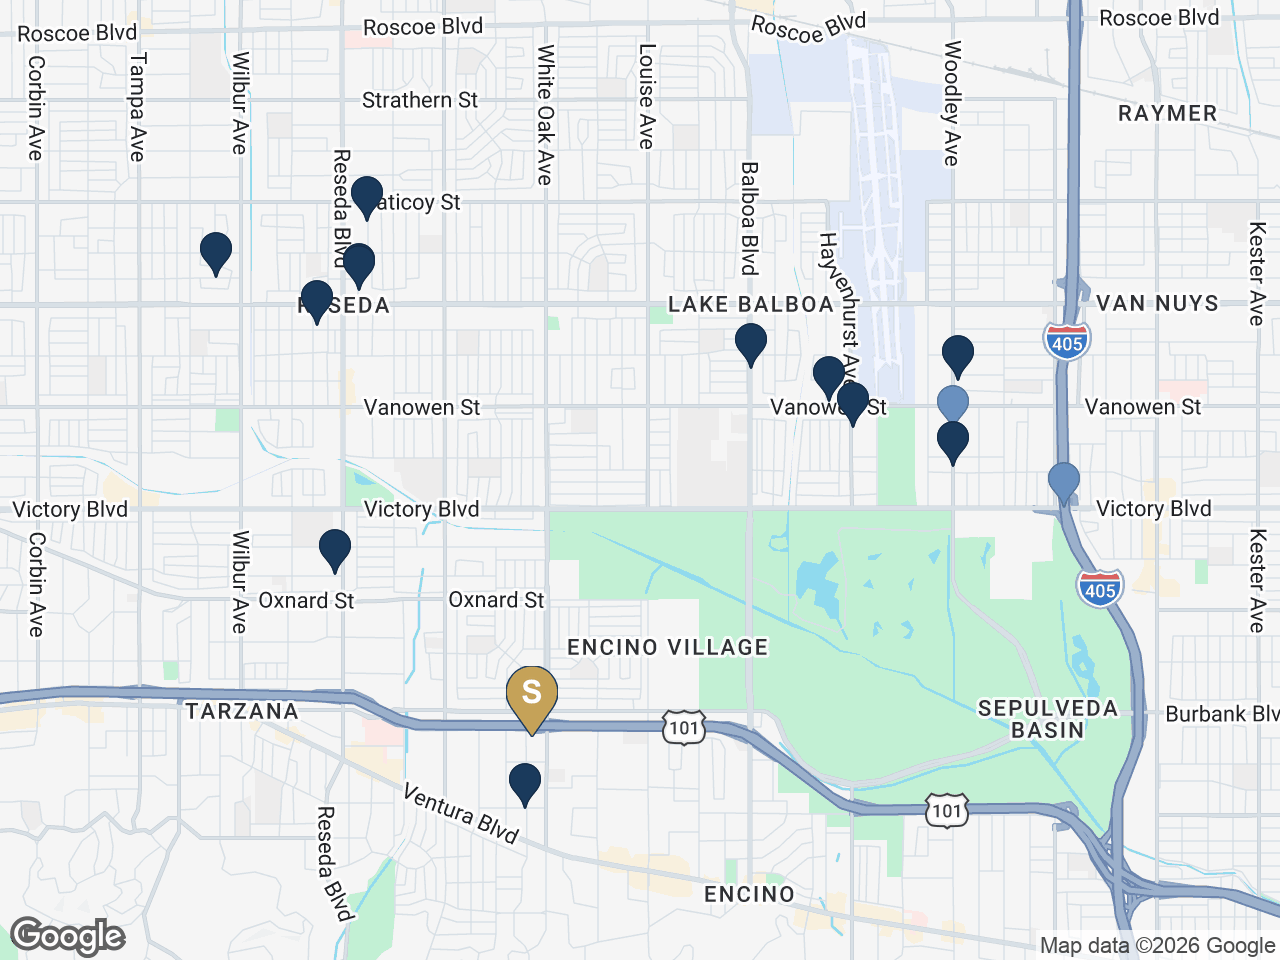
LAAA closings near 5464 Yarmouth Ave

5464 Yarmouth Ave is the gold marker. Navy markers are the 13 apartment buildings the LAAA Team has closed within 3 miles; lighter markers are 2 other LAAA closings in the same area. Repeat sales at one building share a marker. Source: laaa.com/track-record, as of August 20, 2026.

A Track Record Built One Assignment at a Time

Of those closings, 341 are apartment sales covering 4,688 units. CoStar ranks LAAA first in Los Angeles County multifamily transactions across both listing and buyer representation for the trailing three years, and the team has not finished a quarter without a closed sale since it was founded.

Volume matters here for one reason: it is where the buyer list comes from. The buyer for a 66-unit rent-stabilized building in Encino is far more likely to be someone this team has already closed with than someone who finds it on a portal, and a team that closes every quarter is calling those people about something regardless.

The Team Behind the Assignment
Morgan Wetmore
Morgan Wetmore
Associate
Associate covering the San Fernando Valley from the Encino office, specializing in multifamily investment sales across the Valley submarkets including Encino.
Glen Scher
Principal
Glen Scher
Senior Managing Director Investments
Co-founder of the LAAA Team and head of its multifamily sales practice. Since joining Marcus & Millichap in 2014, Glen and partner Filip Niculete have built LAAA into one of Southern California's most active multifamily brokerage groups.
Filip Niculete
Principal
Filip Niculete
Senior Managing Director Investments
Co-founder of the LAAA Team and head of its land and development-site practice. Filip and partner Glen Scher have closed multifamily and development transactions across Southern California together since 2019.
Aida Memary
Aida Memary
Associate, Investments
Logan Ward
Logan Ward
Associate, Investments
Luka Leader
Luka Leader
Associate, Investments
Alexandro Tapia
Alexandro Tapia
Associate, Investments
Blake Lewitt
Blake Lewitt
Associate, Investments
Mike Palade
Mike Palade
Agent Assistant
Tony H. Dang
Tony H. Dang
Business Operations Manager
Tirajeh Vossoughi-Horton
Investment Brokerage Intern
Key Achievements

Chairman's Club - Marcus & Millichap's top-tier annual honor
National Achievement Award - multiple years, both partners
#1 Most Active Multifamily Team in LA County - CoStar 2019-2021
Sales Recognition Award - every year since 2016
493 closed transactions - $1.55B in sales volume

As Featured In
How We Market Your Property
Position the Story, Reach the Market, and Work the Buyer List
23,500+Active Email Subscribers
36,000+Owner & Investor Contacts
60,000+Buildings Tracked
100+Targeted Buyer Calls

Our public, continuously maintained reach combines active email subscribers, owner and investor contacts, a building-owner database, and targeted direct buyer calls for each listing.

The buyers for a 66-unit Encino building are a list, not an audience. We work the list.

The Campaign Plan

01

Direct Outreach To Encino Apartment Owners

We call the owners of the buildings around this one before the property reaches a portal. A 66-unit rent-stabilized asset in Encino trades to a buyer who already owns in the submarket far more often than to one discovering it through a listing site.

02

The 1031 Exchange Buyer Pool

Exchange buyers work to a deadline, and a property of this size absorbs a large exchange in a single transaction. We track identification windows across our active buyer list and bring the ones with a clock running.

03

Institutional And Family Office Coverage

Buildings of 50 units and above in Encino reach a different pool than a 20-unit asset. That pool is small, it is known to us, and it is worked directly rather than through mass distribution.

We Sell This Submarket Every Week

Encino and the surrounding South Valley are where this team works. The buyer who takes this building is very likely someone we have already traded with.

The Underwriting Survives Diligence

Deals fall apart in escrow when the marketed number cannot be rebuilt from the documents. Ours is built from the seller's own statements and a reassessed tax line, so retrading has nothing to attach to.

Both Partners On Every Assignment

Glen Scher and Filip Niculete are both on this assignment from pricing through closing, not a name on a cover and an associate on the calls.

The marketing plan follows the evidence. Buildings of this size and regulatory status in Encino trade rarely, and when they do the buyer is usually already in the submarket. The campaign is built around reaching that group directly and giving them an underwriting they can lend against on the first pass.

There is one competing offering on Yarmouth Avenue at present. Understanding precisely how it is positioned, and where this property differs, shapes both the timing and the pricing of the launch.

Our Active Multifamily Listings
Current LAAA Team Multifamily Availabilities and Escrows
AddressCityUnitsAsking Price$/UnitCapStatus
10455 Magnolia BlvdNorth Hollywood26$9,200,000$353,8465.03%Available
180 Holly AvenueCarpinteria19$8,950,000$471,0534.80%Available
2727 3rd StreetSanta Monica22$7,650,000$347,7275.16%Available
31701 Ridge Route RdCastaic33$7,500,000$227,2735.64%Available
3607 Pacific AveMarina del Rey6$5,395,000$899,1674.75%Available
2001-2005 Grismer AvenueBurbank14$5,350,000$382,1434.56%Available
755 E Pine StreetAltadena19$5,195,000$273,4216.68%Available
7018 Alabama AveCanoga Park9$5,100,000$566,6675.27%Available
4603 La Mirada Avenue & 1255 Lyman PlaceLos Angeles9$4,450,000$494,4445.28%Available
24846 Walnut StSanta Clarita16$4,200,000$262,5005.13%Available
12314 & 12320 Washington PlCulver City8$3,096,000$387,0004.78%Available
11025 Blix StToluca Lake4$2,700,000$675,0005.27%Available
1303-1305 Laveta TerraceLos Angeles10$2,590,000$259,0004.24%Available
1807 Montana StreetLos Angeles4$2,395,000$598,7505.84%Available
12231 Pacific AveLos Angeles7$1,900,000$271,4295.02%Available
5614 W Adams BlvdLos Angeles7$1,795,000$256,4296.52%Available
24513-24519 Walnut StSanta Clarita3$1,095,000$365,0004.31%Available
20234 Roscoe BlvdWinnetka25$4,750,000$190,0005.51%In Escrow
10814-10818 Blix StNorth Hollywood18$4,495,000$249,7226.24%In Escrow
13915 Sherman WayVan Nuys15$3,750,000$250,0005.80%In Escrow
3361 Hamilton WayLos Angeles4$2,800,000$700,0005.62%In Escrow
24802 & 24806 Walnut StSanta Clarita7$1,725,000$246,4295.31%In Escrow
Total (22 listings)285$96,081,000$337,1265.27%

The LAAA Team is currently marketing 17 multifamily listings with 5 more in escrow, together representing 285 units and $96.1M of asking value. Every assignment runs on the same marketing platform proposed for 5464 Yarmouth Ave.

Listings and statuses as published at www.laaa.com/listings; pricing and status are subject to change. The summary row shows total units and total asking value, the blended price per unit across all listings, and the median published cap rate.

Buyer Profile & Transaction Strategy
Who Is Most Likely to Buy, and How We Create Competition

Market Context

Encino has produced very few closed sales of rent-stabilized buildings at this scale. Every one that did close in the surrounding half mile settled between $211,000 and $228,000 per unit, and the buyers were operators rather than merchant developers.

The one competing offering on the street asks a materially higher figure per unit for a larger-unit building that is not rent-stabilized. It has been available since late June without a price change, which is useful information about where this segment of the market is actually clearing.

Time on market has been short for the two buildings that traded with disclosed income. Newcastle Towers carried 74 days and 17340 Burbank carried 21, in a submarket where this combination of size and regulatory status comes up rarely.

Positioning Thesis

The property is positioned to the buyer who wants scale in a supply-constrained submarket and is comfortable with rent stabilization. That buyer underwrites turnover rather than immediate repositioning, values the completed capital work because it removes near-term exposure, and prices the 26 unrenovated units as the part of the return they control.

Current lender terms for this asset class in this submarket run in the low-to-mid 6% range on five to seven year money with thirty year amortization. A buyer taking roughly 60% leverage covers debt service comfortably on current operations, which widens the pool beyond all-cash purchasers.

Likely Buyer Profiles

Likely Buyer 01

The Encino And South Valley Operator

Already owns rent-stabilized product within a few miles, already runs the turnover math, and does not need the regulatory framework explained. This is the most probable buyer and the first group we call.

Likely Buyer 02

The 1031 Exchange Buyer

Needs to place a large amount of equity against a deadline. A 66-unit property absorbs an exchange that would otherwise take three separate closings, which is worth real money in execution risk.

Likely Buyer 03

The Long-Hold Family Office

Buys for durability rather than a five-year exit. Completed seismic, roof and plumbing work matters more to this buyer than to any other, because they are the one who would otherwise fund it.

Transaction Strategy

01

Underwrite It Before They Do

Every serious buyer will rebuild the operating statement on a reassessed tax figure. We publish it that way from the first day, so the conversation starts at the number a buyer would have reached anyway rather than at one they have to correct.

02

Answer The Rent Control Question First

The Rent Stabilization Ordinance governs all 66 units. Presenting that plainly, alongside the turnover history that shows how the rent gap is actually captured, removes the objection that otherwise surfaces in week three and costs a deal its momentum.

03

Separate This Building From 5150 Yarmouth

5150 Yarmouth is the only other building offered on this street. It is a larger-unit property that is not subject to the Rent Stabilization Ordinance, and it has been available since 6/23/2026 without a price change. Naming that difference in the first conversation keeps a buyer comparing unit size and regulatory status rather than treating the two buildings as interchangeable.

Investment Overview
5464 Yarmouth Ave
66Units
51,120Building SF
1969Year Built
60,960Lot SF

5464 Yarmouth Avenue is a 66-unit apartment property built in 1969 on a 1.4 acre parcel in Encino, two blocks north of Ventura Boulevard and immediately west of White Oak Avenue. The improvements total 51,120 square feet across two buildings, zoned R3-1 with a Medium Residential General Plan designation.

The unit mix runs seven studios, 45 one-bedrooms, twelve two-bedrooms and two three-bedrooms. Unit sizes are confirmed in two places: the rent roll and the ownership's own published floor plans agree exactly, at 500 square feet for a studio, 700 for the standard one-bedroom, 900 for the typical two-bedroom and 1,120 for a three-bedroom.

Ownership has been turning units as they vacate. Forty of the 66 are renovated, and the permit record shows the work: eleven units received new subpanels and lighting in a single 2024 program. Twenty-six units have not yet been through that cycle.

All 66 units are registered under the Los Angeles Rent Stabilization Ordinance. Rent increases on occupied units follow the annual allowable adjustment, so the gap between in-place and market rent is realized as units turn rather than through notice.

The property is positioned to the buyer who wants scale in a supply-constrained submarket and is comfortable with rent stabilization. That buyer underwrites turnover rather than immediate repositioning, values the completed capital work because it removes near-term exposure, and prices the 26 unrenovated units as the part of the return they control.

Current lender terms for this asset class in this submarket run in the low-to-mid 6% range on five to seven year money with thirty year amortization. A buyer taking roughly 60% leverage covers debt service comfortably on current operations, which widens the pool beyond all-cash purchasers.

5464 Yarmouth Ave

Investment Highlights

  • 66 units across two buildings on 1.4 acres in Encino, with a courtyard pool, a heated spa, on-site laundry, a community lobby and controlled access
  • 40 of the 66 units have been renovated, leaving 26 units that have not yet been turned
  • The mandatory soft-story retrofit is complete, with a Certificate of Compliance issued 12/31/2019 against an Order to Comply dated 8/4/2016
  • Major systems carry documented recent work: the roof was replaced in 2019, gas piping and regulators were replaced with earthquake shutoff valves in 2019, and the domestic hot and cold water verticals were repiped in 2023
  • 95.5% occupied at 63 of 66 units, with a signed lease in place on a fourth
  • In-place rents sit $250,241 per year below the rent roll's own market column across the 66 units
  • Water, sewer and gas are master-metered, with $70,520 of that cost recovered each year through the utility bill-back carried in additional income
Location Overview
A Half Mile North Of Ventura Boulevard

The property sits on Yarmouth Avenue between Burbank Boulevard and Ventura Boulevard, in the Encino-Tarzana Community Plan area of Council District 4. The 101 Freeway is roughly half a mile north and the Encino Courtyard and Encino Town Center retail nodes are within a short drive on Ventura Boulevard.

The 91316 zip code holds 29,491 residents at a median age of 44.2 and a median household income of $92,311. Half of its 12,883 occupied housing units are renter-occupied, and 6,648 of its housing units sit in buildings of 20 units or more, which is a genuinely apartment-oriented submarket rather than a single-family area with apartments in it.

Median gross rent in the zip code is $2,209. The subject's own market rents run $1,800 for a studio and $2,020 to $2,140 for a one-bedroom, so the building rents at or beneath the surrounding median rather than above it.

Walk Score rates the immediate block 53, described as somewhat walkable, with a transit score of 40. The location trades a walkable storefront setting for a quiet residential street two blocks off the boulevard.

Property & Location Details
Address5464 Yarmouth Ave
CityEncino, CA 91316
APN2162-016-003
Year Built1969
Building SF51,120
Lot Size60,960 SF (1.4 ac)
Units66
ParkingCovered on-site parking
Location Map
Property Details
5464 Yarmouth Ave
Property Overview
Units66
Year Built1969
Building SF51,120
Lot SF60,960
APN2162-016-003
Unit Mix
44x 1 Bed / 1 Bath700 SF
9x 2 Bed / 2 Bath900 SF
7x Studio / 1 Bath500 SF
2x 3 Bed / 2 Bath1,120 SF
2x 2 Bed / 2 Bath, Small Plan850 SF
1x 2 Bed / 2 Bath, Large Plan1,150 SF
1x 1 Bed / 1 Bath, Deluxe/Den800 SF

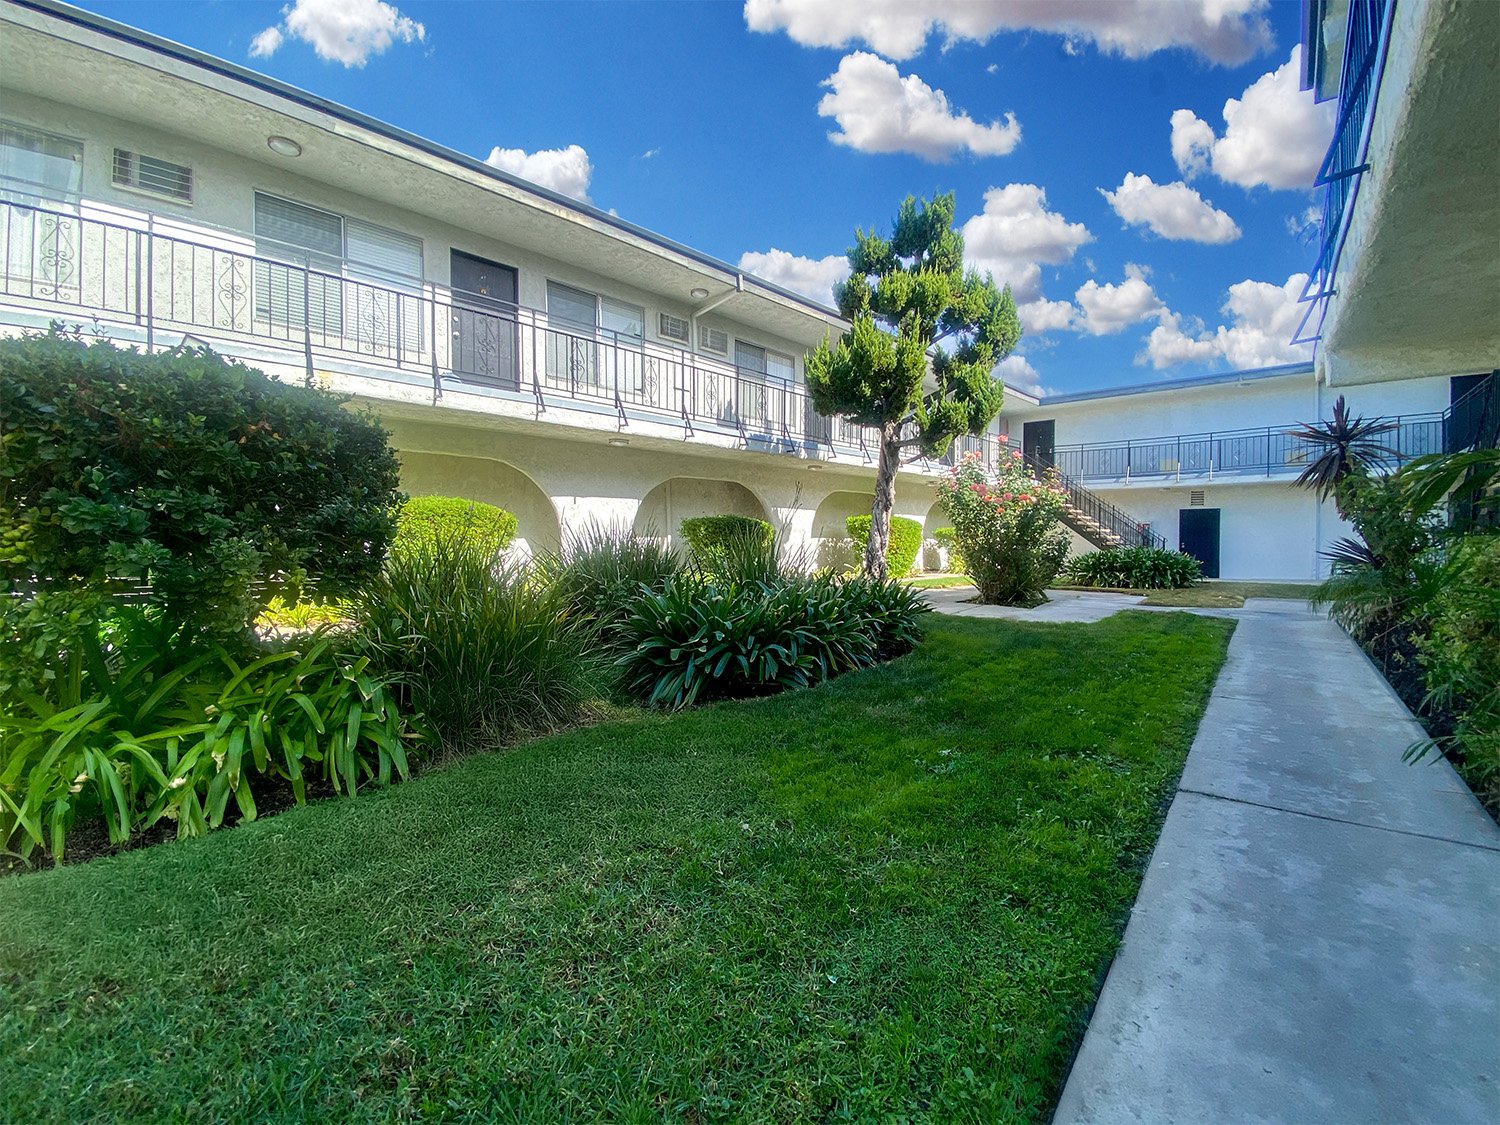
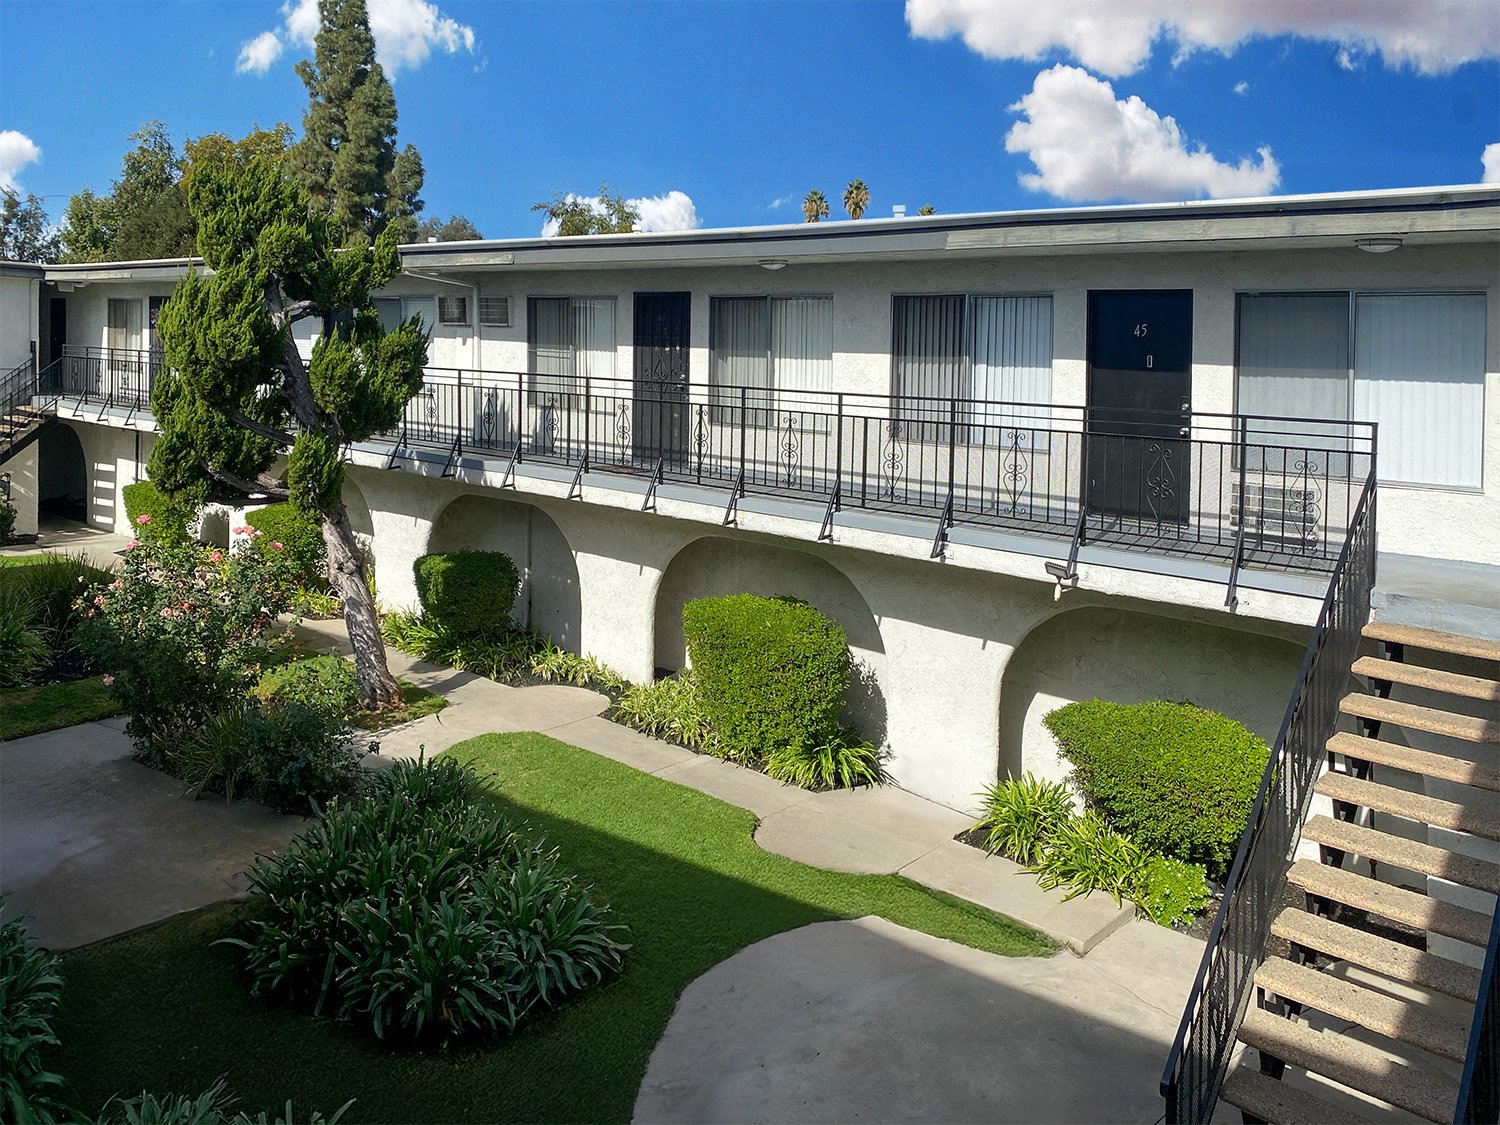
Two wood-frame buildings of two stories each, arranged around a landscaped courtyard with a swimming pool and a separate heated spa. Access is controlled and gated, parking is covered and on site, and the property carries laundry facilities, a community lobby, an outdoor barbecue area and on-site maintenance.

Units carry air conditioning, gas ranges, dishwashers, microwaves, disposals, large closets, cable access and recessed lighting. Renovated units add hardwood-style flooring, granite counters, stainless appliances and higher ceilings, and a portion of the units have private patios or balconies.

The permit record supports the condition. The roof was replaced in 2019 at a stated valuation of $193,000 across 380 squares. Gas piping and regulators were replaced in 2019 along with earthquake shutoff valves. The domestic hot and cold water verticals were repiped in 2023. The soft-story retrofit finished in 2019 and the parcel is not a possible non-ductile concrete building.

Property Photos
5464 Yarmouth Ave
1 / 10 5464 Yarmouth Ave photo
Exterior

Click any image to enlarge. Images depict the property and representative interiors. Source: listing media and site photography.

Rent Comparables
Achieved and Asking Rents in the Immediate Submarket
Rent Comps Map
AddressUnit TypeSFAsking RentDistance
15415 Newcastle Ave, Encino, CA 913161 Bed / 1 Bath-$1,5490.31 mi
15415 Newcastle Ave, Encino, CA 913162 Bed / 1.5 Bath-$1,8040.31 mi
15415 Newcastle Ave, Encino, CA 913163 Bed / 2 Bath-$1,9070.31 mi
217340 Burbank Blvd, Encino, CA 913161 Bed / 1 Bath-$1,6760.50 mi
217340 Burbank Blvd, Encino, CA 913162 Bed / 2 Bath-$1,9050.50 mi
217340 Burbank Blvd, Encino, CA 913163 Bed / 2 Bath-$2,3800.50 mi
35461 Yarmouth Ave, Encino, CA 913161 Bed / 1 Bath780 (est.)$2,1560.05 mi
45150 Yarmouth Ave, Encino, CA 913161 Bed / 1 Bath-$2,3030.43 mi
45150 Yarmouth Ave, Encino, CA 913162 Bed / 2 Bath-$2,6000.43 mi
45150 Yarmouth Ave, Encino, CA 913163 Bed / 2 Bath-$3,7080.43 mi
55500 Newcastle Ave, Encino, CA 913161 Bed / 1 Bath700 (est.)$1,6000.21 mi
65501 Newcastle Ave, Encino, CA 913161 Bed / 1 Bath847 (est.)$2,4950.30 mi
717200 Burbank Blvd, Encino, CA 913162 Bed / 2 Bath1,000 (est.)$2,9480.64 mi
Average (13 rent comps)832 (incl. est.)$2,2330.38 mi

The most reliable rent evidence in this submarket comes from the two rent-stabilized Encino buildings that actually sold. At 5415 Newcastle Avenue, a third of a mile away, in-place rents at the February 2025 close were $1,549 for a one-bedroom and $1,804 for a two-bedroom. At 17340 Burbank Boulevard, half a mile away and the most recent trade in the set, they were $1,676 and $1,905. These are rents a buyer verified in diligence and then paid for, not rents advertised online.

This property already collects more than either of them. Its one-bedrooms average roughly $1,733 against $1,549 and $1,676, which says the rent roll here has been managed rather than left alone.

The market rents carried in this analysis are bracketed by a transacted view rather than an asking one. The 17340 Burbank listing underwrote its one-bedrooms to $2,100 and its two-bedrooms to $2,650 on turnover, and a buyer paid for that projection at a rent-stabilized building half a mile from here. The subject carries $2,020 to $2,140 and $2,550 to $2,610.

Two nearby properties sit above that range for reasons that do not transfer. 5461 Yarmouth Avenue, directly across the street and marketed under the same name by a different owner, asks $2,062 to $2,250 for a 780 square foot one-bedroom with a concession running, and carries a fitness center, package lockers and a clubhouse this property does not. 5150 Yarmouth Avenue collects $2,303 on a one-bedroom, in units averaging nearly twice the size of these and with no rent stabilization.

Every pro-forma rent carried in the analysis sits at or above the highest rent this building already achieves for that unit type. The pro forma does not price any unit below what the property has already proven it can collect.

Sale Comparables
3 Closed Sales in the Submarket
Sale Comps Map
AddressYrUnitsBldg SFSale Price$/Unit$/SFGRMCapDate
15415 Newcastle Ave, Encino, CA 9131619646671,765$14,750,000$223,485$20610.365.44%2025-02-25
217340 Burbank Blvd, Encino, CA 9131619642724,730$6,150,000$227,778$24910.525.38%2025-10-31
35130 Yarmouth Ave, Encino, CA 9131619535347,537$11,200,000$211,321$236--2025-06-23
Median (3 comps)47,537$11,200,000$223,485$23610.445.41%-

Encino has produced very few closed sales of rent-stabilized buildings at this scale. Every one that did close in the surrounding half mile settled between $211,000 and $228,000 per unit, and the buyers were operators rather than merchant developers.

The one competing offering on the street asks a materially higher figure per unit for a larger-unit building that is not rent-stabilized. It has been available since late June without a price change, which is useful information about where this segment of the market is actually clearing.

Time on market has been short for the two buildings that traded with disclosed income. Newcastle Towers carried 74 days and 17340 Burbank carried 21, in a submarket where this combination of size and regulatory status comes up rarely.

1. 5415 Newcastle Ave, Encino, CA 91316 - The anchor comp. Same submarket, same 66 units, same RSO status and the same 1960s vintage band, closed 2025-02-25 within a third of a mile. 1,087 SF average unit against the subject's 732 SF; 56 of 66 units are 2 bed / 1.5 bath; the subject is 45 one-bedrooms; Seller-owned solar tied to hot water heating; 66 tuck-under and carport spaces Also LAHD RSO registered at 66 units, the same regulatory basis as the subject

2. 17340 Burbank Blvd, Encino, CA 91316 - Closest in time at 2025-10-31 and the only other Encino RSO trade with disclosed income, half a mile away. Weighted below Newcastle on size. 27 units against 66; a materially smaller building; 916 SF average unit against the subject's 732 SF; 14 one-bedroom, 12 two-bedroom and one three-bedroom LAHD RSO registered at 27 units; Separately metered for gas and electric; the subject is master-metered with partial recovery; Seller concessions were reported; closed at 94.57% of list

3. 5130 Yarmouth Ave, Encino, CA 91316 - Same street, under half a mile, RSO and of comparable scale, so it carries real weight on price per unit and per foot. It carries none on cap or GRM because no income was disclosed. 1953 construction against the subject's 1969; 897 SF average unit against the subject's 732 SF; 53 units against 66 LAHD RSO registered at 53 units

Opinion of Value
Suggested List Price and Expected Sale Range
BasisPrice$/Unit$/SFGRM CurrentGRM Pro FormaCap CurrentCap Pro Forma
Suggested list price$15,000,000$227,273$293.4310.378.845.52%7.07%
Range top$15,400,000$233,333$301.2510.649.075.34%6.86%
Midpoint$14,825,000$224,621$290.0010.258.745.60%7.17%
Range bottom$14,250,000$215,909$278.769.858.405.88%7.51%

Property taxes reassess at the sale price, so the net operating income and therefore the capitalization rate are recalculated at every rung above.

On-Market Comparables
Active Competition and the Pricing Ceiling
On-Market Comps Map
AddressYrUnitsBldg SFList Price$/Unit$/SFGRMCapDate
15150 Yarmouth Ave, Encino, CA 9131619644565,269$16,200,000$360,000$24811.434.60%2026-08-20
Median (1 comps)65,269$16,200,000$360,000$24811.434.60%-

5150 Yarmouth Ave, Encino, CA 91316 - Carried as competition and never as a sold comp. It is an unsold asking price, it is not rent-stabilized, and its units average nearly twice the subject's. It sets a ceiling nobody has paid rather than evidence of value. 1,305 SF average unit against the subject's 732 SF, a materially different product; 37 of 45 units are two-bedroom; the subject is 45 one-bedrooms of 66; Elevator, fitness center and sauna; three stories over a semi-subterranean garage; 72 parking spaces in a semi-subterranean garage

Financial Analysis
5464 Yarmouth Ave

Unit Mix & Scheduled Rent

UnitsTypeApprox SFCurrent RentCurrent MonthlyMarket RentMarket Monthly
441 Bed / 1 Bath700$1,733$76,274$2,047$90,070
92 Bed / 2 Bath900$2,280$20,516$2,570$23,130
7Studio / 1 Bath500$1,406$9,844$1,776$12,430
23 Bed / 2 Bath1,120$3,069$6,137$3,210$6,420
22 Bed / 2 Bath, Small Plan850$1,948$3,897$2,360$4,720
12 Bed / 2 Bath, Large Plan1,150$1,894$1,894$2,410$2,410
11 Bed / 1 Bath, Deluxe/Den800$2,008$2,008$2,244$2,244
Total Scheduled Rent$1,827$120,571$2,143$141,424
Additional Income[1]-$7,609-$7,609
Monthly Scheduled Gross Income-$128,179-$149,033

Annualized Operating Data

 CurrentMarket
Scheduled Gross Income[2]$1,538,151$1,788,393
Vacancy Reserve at 2.8%[3]($43,405)($50,913)
Gross Operating Income$1,494,746$1,737,480
Operating Expenses($666,641)($676,351)
Net Operating Income$828,105$1,061,129
Loan Payments (Illustrative)($661,466)($661,466)
Pre-Tax Cash Flow (Illustrative)$166,638$399,662
Principal Reduction (Illustrative)$106,458$106,458
Total Return Before Taxes$273,096$506,120

Annualized Expenses

 CurrentPro Forma
Contract Services[4]$33,000$33,000
General Admin[5]$9,900$9,900
Insurance[6]$59,400$59,400
Management Fee[7]$59,790$59,790
Marketing[8]$12,000$12,000
Payroll[9]$40,000$40,000
Repairs Maintenance[10]$56,100$56,100
Reserves[11]$6,600$6,600
Taxes[12]$195,000$195,000
Utilities[13]$194,851$194,851
Underwriting Expense Adjustment[14]$0$9,710
Total Operating Expenses$666,641$676,351
Expense Ratio44.6%38.9%
Per Unit$10,101$10,248
Per Square Foot$13.04$13.23

Notes to the Operating Statement

[1] Additional Income: Seller's trailing twelve-month utility recoveries, laundry, cable, vending and miscellaneous income. Interest and application, late, pet and NSF fees excluded.

[2] Scheduled Gross Income: In-place lease charges from the rent roll dated 8/13/2026 with the monthly rent concession added back, annualized.

[3] Vacancy Reserve: Underwritten at 3.0%, the two units vacant after unit 04's 8/15/2026 lease-up.

[4] Contract Services: Underwritten annual estimate, not a seller T12 actual.

[5] General Admin: Underwritten annual estimate, not a seller T12 actual.

[6] Insurance: Underwritten annual estimate, not a seller T12 actual.

[7] Management Fee: Underwritten annual estimate, not a seller T12 actual.

[8] Marketing: Underwritten annual estimate, not a seller T12 actual.

[9] Payroll: Underwritten annual estimate, not a seller T12 actual.

[10] Repairs Maintenance: Underwritten annual estimate, not a seller T12 actual.

[11] Reserves: Underwritten annual estimate, not a seller T12 actual.

[12] Taxes: Underwritten annual estimate, not a seller T12 actual.

[13] Utilities: Taken from the seller's T12.

[14] Underwriting Expense Adjustment: Aggregate difference between classified T12 expense lines and the modeled current and pro forma operating expense totals.

Owner-reported figures are unaudited. A buyer should verify all income and expenses in due diligence.

Summary
Operating Data
Price$15,000,000
Number of Units66
Price per Unit$227,273
Price per SF$293.43
Current GRM10.37
Market GRM8.84
Current Cap Rate (LAAA calculation: current NOI / recommended value)5.52%
Market Cap Rate (LAAA calculation: market NOI / recommended value)7.07%
Proposed Financing (Illustrative)
Loan Amount$9,000,000
Down Payment$6,000,000
Interest Rate6.20%
Amortization30 years
DCR1.25

Illustrative financing assumption. Not a quoted or committed loan. A buyer should obtain its own terms.

Our opinion of value is $15,000,000, which is $227,273 per unit and a 5.52% capitalization rate on current operations. That underwriting already carries property taxes reassessed at the purchase price, which is the single largest difference between what a seller's statement shows and what a buyer actually earns.

The closed comparables bracket that number on every measure, each restated at the price the property actually sold for rather than the price it was marketed at. 5415 Newcastle Avenue, a 66-unit rent-stabilized building of the same vintage a third of a mile away, closed at $223,485 per unit, a 10.36 gross rent multiplier and a 5.44% capitalization rate. 17340 Burbank Boulevard closed at $227,778 per unit, 10.52 and 5.38%. 5130 Yarmouth Avenue closed at $211,321 per unit.

This property sits inside that range per unit, in line with it on the multiplier at 10.37, and above both on going-in yield at 5.52%. A buyer earns more here on day one than either of those trades delivered.

On price per square foot the property prices above the closed set, at $293 against a range of $206 to $249. The reason is physical rather than promotional: units here average 732 square feet, the smallest in the comparable set, against 897 to 1,087 elsewhere. Smaller units carry more rent per foot, and this building collects $2.36 per square foot per month against $1.65 to $1.97 at the comparables.

Capturing the full rent gap as units turn produces a net operating income of $1,061,129, a 7.07% return on the recommended value. That is a projection tied to turnover rather than a schedule, because the Rent Stabilization Ordinance governs every unit and the timing belongs to the tenants, not to ownership.

The competing offering at 5150 Yarmouth asks $16,200,000 for 45 units. Its own offering memorandum reports fiscal 2025 net operating income of $745,374, a 4.60% return on its asking price, and its rent roll collects $112,539 per month. This property collects more each month from 21 additional units. It has been on the market since June without a price change.

Recommended List Price
$15,000,000

Supported value range: $14,250,000 to $15,400,000

Disclosures

Income is taken from the rent roll dated 8/13/2026 and the twelve-month operating statement through 7/31/2026. The four utility lines and both additional-income lines carry the seller's trailing actuals, and every other line is an LAAA estimate identified in the notes to the operating statement.

Property taxes are reassessed at 1.30% of the recommended value. The seller's trailing tax reflects a Proposition 13 basis established by a 2019 transfer between related parties and does not carry to a buyer.

Financing shown is an illustration drawn from current lender terms quoted in this submarket in June 2026, not a commitment or a quote for this property.

A preliminary title report has not been ordered. Existing financing recorded in 2019 has not been confirmed as to amount, rate, maturity or assumability.

Two permits remain open in the public record and are not represented as completed work: twelve electric vehicle chargers issued in 2022 and a single unit subpanel issued in December 2024.